
As we cannot hike without a map in a forest which we do not know we also cannot work on mobility planning without applying GIS (a mobility expert from Milan)
At the end of the May 2024, URBACT IV Action planning network Plans for Urban Mobility Actions (PUMA) team members and their URBACT Local Group (ULG) members had an online workshop about Geographic Information Systems (GIS) in mobility planning. The goals of the training were first, to teach partners about the principles and basics of GIS including data collection, visualization on maps and making analysis. Second, GIS experts were invited who introduced case studies for complex mobility analysis conducted by GIS methods. The presentations of the training were completed by interactive exercises around mobility indicators and analysing maps about specific mobility issues. Through the exercises partners understand the logic of developing indicators from available mobility data and gained experiences in map reading meaning making conclusions based on maps.
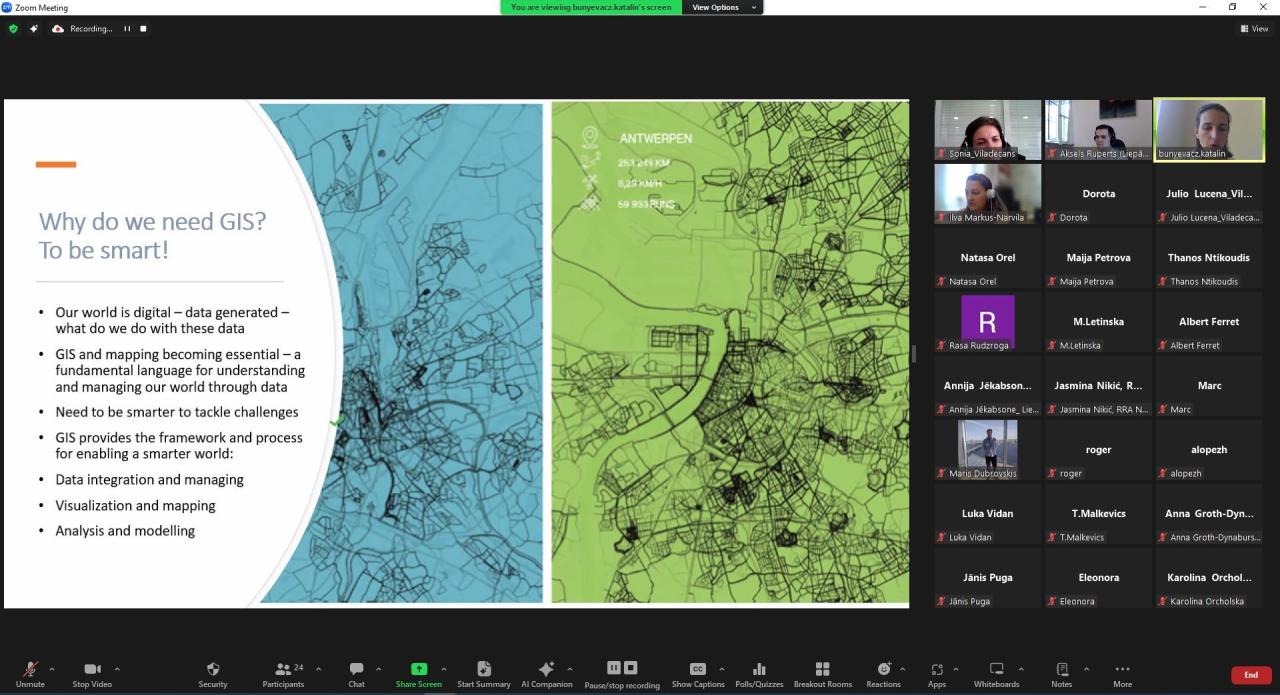
The main message of the training was that by GIS tools and methods, cities can COLLECT spatial mobility data, can VISUALIZE these data on MAPS, moreover they can ANALYSE data. These are the 3 main components of GIS: data, maps and analyses.
Maps are the geographic container for the data layers and analytics one wants to work with. GIS integrates many kinds of data layers using spatial location. Most data have a geographic component. GIS data includes imagery, features, and base maps linked to spreadsheets and tables. By Spatial analysis it is possible to evaluate suitability and capability, estimate and predict, interpret and understand, and much more, opening up new perspectives to decision-making.
During the online training we have worked on these 3 components of GIS making the following conclusions:
Data collection
Our world is digital which means that more and more data are generated also in the context of mobility raising the question that what do we do with these data. City administrations should collect and apply the available mobility data to understand the mobility trends of their cities. In addition, cities need to set up and operate a GIS system where the collected spatial data can be stored and shared.
More specifically, working on a sustainable urban mobility plan, it is inevitable to collect mobility data such as data about the location of bus, tram stops, city bike stations, railway stations, road network, cycling routes, walkways, pedestrian areas, parking plots, no parking zone, limited speed zones etc. On top of these, it is also recommended to collect experiential data asking citizens about their opinion regarding mobility issues in the city. For instance, citizens can be asked where the city should build additional cycling path or which places are not safe in the city in terms of mobility etc. These experiential data can be jointly analysed with expert data in a GIS software which contributes to successfully deliver such complex planning process as the development of a mobility plan.
Visualization
As most of the mobility data has spatial character, it is possible to visualize them on maps. Although, map making is not an easy task, cities need to invest time, knowledge, and even financial resources to design maps for mobility plans or reports. If that much energy is invested in map-making it is important to be aware that maps are not just illustrations of planning documents. Maps are tools which help cities to develop the fact-based content of their mobility plan and help to transfer the conclusions and messages of the plans. Therefore, maps are kind of a communication tool: a language which translates big amount of data into key messages.
Visualizing mobility data on map – the road network of the city of Milan, Italy

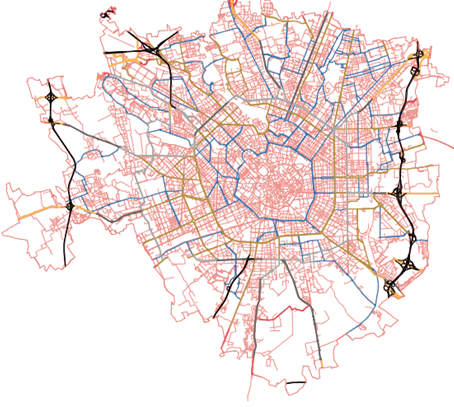
Source: Annual mobility report of the city of Milan in 2022: https://datashare.amat-mi.it/index.php/s/PgnBD2Kw2zJBK97
Analyses
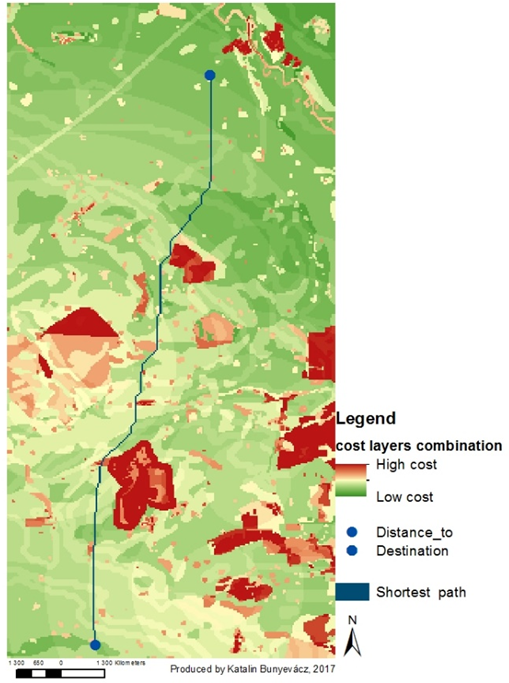
The most well-known way of applying GIS in mobility planning is visualizing data on maps. For instance, public transport network or parking zones of a city are visualized on maps. However, GIS is not only about visualization. It offers much more: analyses! There are several analyses tools available in GIS softwares which can be well applied in order to identify problems, analyse suitability of areas for specific purposes or to understand mobility trends of a city.
One of the most common type of analyses is the multi-criteria analysis which requires the application of several tools available in a GIS software. In such analysis, first, you identify attributes that you want to investigate in your analysis. Second, you develop indicators that can represent best the attributes considering also the availability of spatial data that can be used for developing the indicator. Third, you decide what is the weight of each indicator in your analysis, and how important they are compared to each other. Fourth, you visualize the spatial indicators on different maps. Finally, you overlay all the maps cumulating the values of each pixel received at each indicator.
The result is one map that shows which areas are more and which ones are less suitable for a project according to the indicators applied in the analyses. For such complex planning process as designing a city level mobility plan, multi-criteria analysis is a recommended tool.
To conclude, mobility planning is a complex process where managing big amount of mobility data is challenging. GIS tools can help cities to manage, visualize and even analyse mobility data to be able to make smarter decisions and produce better-quality mobility plans. Indeed, applying GIS requires certain knowledge, expertise and financial resources. Still, it is worth to invest in GIS - as it is worth to buy a map before going to hike. We don’t want to be lost; we want to know which is the right path of improving our cities’ mobility!