Spin-Off' project that responds to the specific needs of the partners and will be suitable for further development and will be in compliance with the requirements of the respective Transnational/Interregional Programmes and Calls. Spin-off projects are meant to kick-start the implementation of the LAPs.
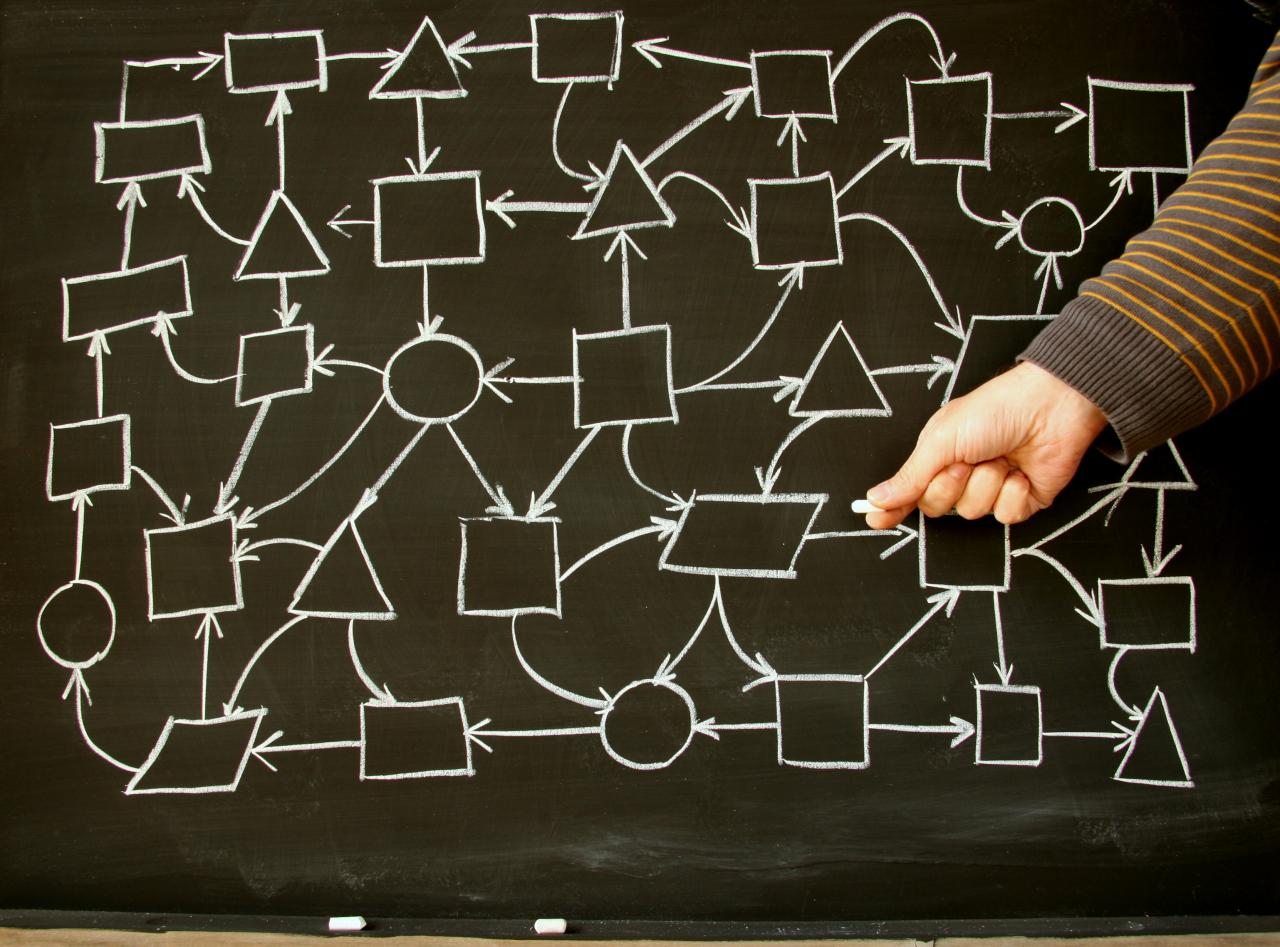
Social innovation is about addressing very complex "wicked" problems, in which actors from across many sectors - governments, corporations, educational institutes, NGOs, and, of course, citizens - need to work together intensively for a prolonged period of time. In this way, deep lessons learnt can be shared, and collaborations can come to fruition that align and scale efforts beyond the prototype and project level so as to reach truly collective, integrated and systemic impact. To collaborate successfully, participants need to be able to recognise not only the various interests and perspectives of all stakeholders involved, but also to see the evolving "big picture" of the quality of (potential) connections within all that diversity.
Building this shared understanding is already difficult at the level of a city, when people representing different communities can often meet face-to-face. It is even harder at the national, let alone the European level. The core problem is the fragmentation of collaboration that happens when addressing an intricate web of wicked problems. This requires countless participants to work together, often for a very long duration, and on an array of interrelated solutions. This fragmentation is compounded by everything continuously being in flux: the shifting articulations of the problems, the multitude of approaches, the many stakeholders involved as well as resources available, and so on. Thus, fragmentation of collaboration often results in confusion, the reinventing of many wheels, and only suboptimal solutions. Mapping can help reduce this fragmentation.
Maps are powerful visual artefacts to help people navigate complex spaces. We all know location-based maps that help us navigate from A to B. This geographical metaphor has been extended to create online maps of location-based social innovation services and resources, such as the Paris map where we can see the location of hundreds of “actors” within the social and solidarity economy. These location-based maps are good at classifying and positioning elements, but less suited for capturing their network of collaborative relations.
Another type of map is the community network map. These do not start from a geographical metaphor to provide the necessary reference points, but instead use salient commonalities of the community network itself, such as the issues, goals, themes, or the “sharings” that their collaboration is about. Such maps provide joint conceptual beacons that help participants and others to explore and navigate their often very complex collaboration space. Typically, social network analysis maps capture some such relations, but in a formal, analytical way. An example is the analysis of the Torino informal startup network. Using full-fledged community network maps, however, their members can interact with the map and see how their goals, themes, activities, organisations, stakeholders and resources interrelate. Participants can perceive how they themselves are positioned in this collaboration landscape; where they might want to take their contribution from there; and visually anchor their own efforts in the collaborative network. In short, this type of mapping both shows and grows the network of collaborative relations, on which the creativity of social innovation depends.
Mapping the BoostInno network projects: the Barcelona Experiment
BoostInno is one of the networks developed in the EU URBACT programme, with the aim to “enable public administrations to play a new role as public booster and brokers/facilitators of social innovation activities/projects/policies, by driving social innovation in, through and out the public sector”. Participating cities are Paris (FR), Strasbourg (FR), Barcelona (ES), Braga (PT), Milan (IT), Turin (IT), Baia Mare (RO), Skane (SE), Wroclaw (PL), Gdansk (PL) and Lviv (UA).
In preparation for one of its transnational workshops in Barcelona in November 2016 (see this video for an impression), we outlined a map of the BoostInno network collaboration, including a set of different views/perspectives highlighting different aspects of the map (Fig. 1).
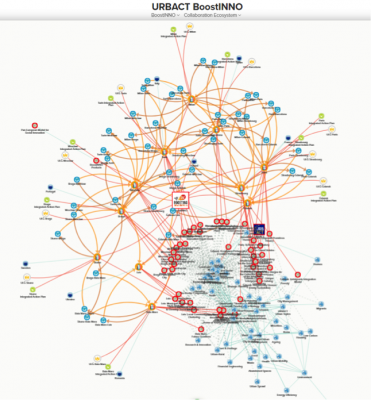
The goal of this experiment was to find out if mapping this engaging collaborative community of cities could help its members to make better sense of who to work with and on what themes. In particular, during this meeting, each city was to make a selection of other cities in the network to plan site visits to. Given that there were representatives of 11 cities present in Barcelona, and that there was only little dedicated time to meet and discuss with potential partners, it was felt that a map showing the common ground might be helpful.
Prior to the meeting, we sent out a survey asking all cities to briefly describe five of their “flagship projects”: local initiatives that could serve as showcases of what they had to offer and share with their European peers. We also asked them to tag their projects with topics from the list of URBACT “Urban Topics”: concrete social innovation topics that cities work on and that URBACT has grouped in categories such as Integrated Urban Development, Economy, Environment, Governance, and Inclusion. Besides mapping those elements, we also added what “sharings” (concrete offerings) the cities wanted to “give” to and “use” from other cities. The resulting map perspectives literally shows the common ground of the BoostInno network, making it much easier to identify the common focus, but also to identify one’s own position and interests in the bigger scheme of things.
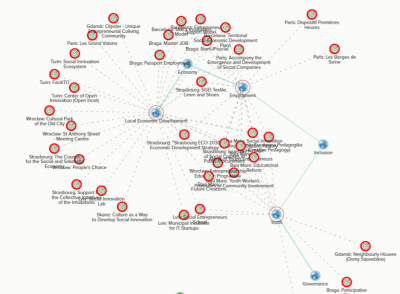
At the workshop, the first author, being the mapmaker, presented the overall map, showing the big picture. A “mapping station” was also set up, where representatives of the various cities could come and visit. The mapmaker then gave each of them a personalized tour showing how their city was positioned the map, and what themes and projects of other cities theirs was most closely related to (Fig.3). In this way, precious meeting time could be used as efficiently as possible, as city representatives could more easily identify the potentially most relevant partners – also present in Barcelona – to talk to.
Participatory community network mapping
The map we created for the Barcelona workshop is only the first step, however. As important as this artefact, if not more, is the mapping & sensemaking process by which the maps are being created and used. To this purpose, a participatory community network mapping methodology is being developed.
Participatory community network mapping is the participatory process of capturing, visualising, and analysing community network relationships and interactions, as well as applying the resulting insights for community sensemaking, building, and evaluation purposes. Key is the involvement of the community members themselves in all of these activities. This involvement means not only that they provide their own data, and after the necessary training maintain their own maps, but also that they start making sense together by having focused conversations about what the different views on the map mean. What implications does the presence of certain hubs of activity in the map mean? How come a particular theme is dangling on the periphery of the map, whereas according to the programme objectives it should play a key role?
But there is another crucial form of participation: the community members themselves should be in control of the language of the map: what types of elements and connections should be included (and which ones therefore not) and what views on the map should be created? This "power of representation" is the foundation of the participatory mapping experience and should be wielded with care. It is an essential introductory stage at the beginning of each legitimate mapping process.
We have only just started. The Barcelona experiment focused on showing proof of concept by defining a common mapping language, and charting the common thematic ground of the participating cities. We are now working on the next steps: zooming in in more detail on selected social innovation activities and shifting the focus from capturing and visualising the data to exploring how the map views can support the sensemaking process.
Outlook
Europe faces a myriad of interconnected wicked problems. Action and collaboration are stimulated through programmes and projects. They are essential instruments in reaching priorities, distributing resources and providing accountability. However, they are not enough. We also need ways to put into context and integrate the numerous issues these programmes and projects address; to explore the collaboration space that exists in between initiatives, communities, and networks. City governments, their departments and partners can then better understand the gaps, capture interesting ideas and identify and align initiatives that do not fit the current instruments. In this way, they can obtain a deepened understanding of the "big picture”. We believe that participatory community network mapping provides both a methodology and way to represent integrated actions and policies, based on the principle of horizontal collaborations and partnerships.
Mapping them puts the all-important but insufficiently known connections of the collaboration space in-between into the limelight. When acted upon, these insights about the qualities of the relationships between stakeholders in and around our cities will increase the impact and success of the Urban Agenda. Most certainly, this will interest the URBACT community. We also hope, however, that this approach will inform thinking about social innovation at the regional, national and EU levels, leading to more truly integrated policies and actions.
A video interview with Aldo de Moor about the mapping experiment:
.
This article is a revised version of this blog post.
It is the result of a co-construction between Aldo de Moor, CommunitySense (NL), and Piotr Wolkowinski, Lead Expert of the URBACT network BoostInno.