Insights from the URGE network and experiences from the Intermunicipal Community of the West Region in Portugal on the mapping of flows and industrial symbiosis in a circular economy.
By Dr. Eleni Feleki, Lead Expert of the URGE Action Planning Network
Cities and Resource Management
The circular approach is comprised of two cycles of materials:
- The biological cycle in which residual materials return to nature safely after use and thus generate living systems such as soil
- The technical cycles that recover and restore products, components, materials at high quality levels, via the implementation of strategies like reuse, repair, manufacturing in order to be able to keep the loop going and retain the economic value as much as possible
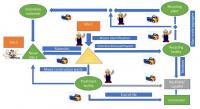
Figure 1: The complexity of the management process
For cities to be able to facilitate the transition towards a circular economy, a better understanding of these cycles is necessary. This means that the flows of resources, waste, materials are imperative to be understood and mapped, as this is the first step towards fostering industrial symbiosis.
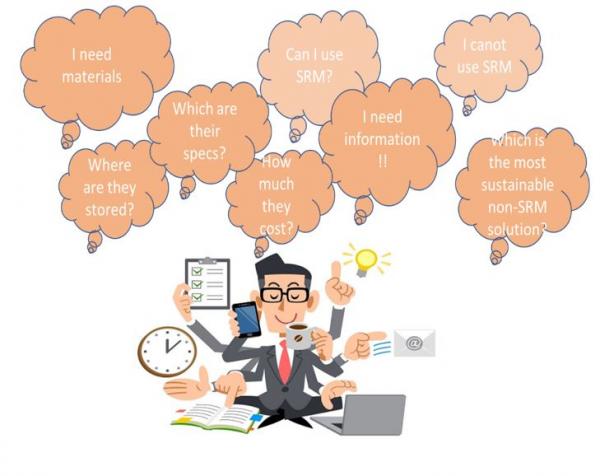
Figure 2: The need for information
Having knowledge of these streams and of their characteristics allows a city to determine and apply appropriate interventions, aimed at improving resource management procedures, leading to improvement of efficiency and sustainability. Implemented interventions under this scope lead to the elimination of what is disposed, to a maximisation of the time that materials are kept into the economy and to a prolongation of the materials’ value, taking also into consideration other aspects, such as the assessment of the ability to reuse them on-site, or their transferring in near-by sites to be either used or even processed. The reference to the urban metabolism model has become a key element in re-directing resource flows sustainably. Mapping of material flows and stocks within the city is needed, in order to increase circularity.
Material flows
Circular Economy is defined as a state in which ‘the value of products, materials, and resources is maintained in the economy for as long as possible, and the generation of waste is minimised. In this context, it is essential to understand an economy’s societal metabolism, i.e. to quantify the amount of materials flowing in and out and monitor how they are used in society in order to draw the level of circularity.
Therefore, the Commission’s Circular Economy package (2018) includes a monitoring framework to measure progress towards a circular economy at both EU and national level. This monitoring framework consists of a set of 10 key indicators, which cover each phase of a raw material’s life cycle and the related economic aspects.
Urban metabolism
The recognition of the concept of urban metabolism (UM) is given to Wolman (1965). At the time of its creation, UM was thought to be a supportive tool in the development of sustainable cities and communities. But now, there are much more applications, like sustainability reporting, mathematical modelling for policy analysis and urban design.
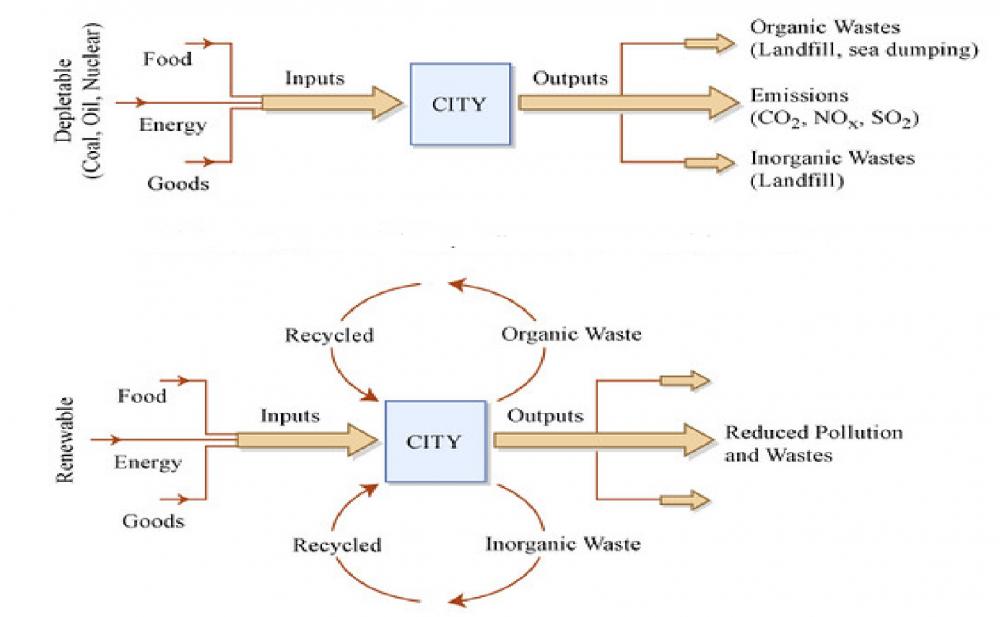
Figure 3: Urban metabolism in a linear vs. circular city
Material flow analysis is the systematic assessment of materials and their stocks and flows over time and space within a defined system. This analysis has proven to be reliable on a national scale, but analysis focused on smaller areas are necessary to gain a better understanding of how material consumption can be controlled and reduced. If this is achieved, opportunities for CE design and for CE progress monitoring will raise.
In models that attempt simulation of urban metabolism, it is essential to identify metabolic actors and to sub-divide them into increasingly precise elements. These can be for example sectors of the economy (i.e. the construction sector). Next, the metabolic flows between these precise elements are identified and assessed. This allows the development of more sophisticated urban models that can lead to optimisation of processes, in line with the principles of CE and can foster industrial symbiosis.
Establishing a robust method to quantify urban material flows, in order to characterise the urban metabolism of different cities worldwide, has been attempted but there are still some remaining methodological gaps (Rosado et al, 2014):
- Lack of a unified methodology
- Lack of material flows data at the urban level
- Limited categorisation of material types
- Limited results about material flows as they are related to economic activities
Action Plan for Circular Economy (APCE): The case of Portugal
At the end of 2017, Portugal approved the APCE (Action Plan for Circular Economy), a strategic model of growth and investment founded on the efficient usage of resources and on diminishing environmental effects.
APCE’s origin lies on international arrangements and deals, such as the Paris Agreement, the Sustainable Development Goals, and continuous settlements with the European Union.
The plan presents three levels of action: (i) national cross-cutting actions that consolidate some of the actions of several governmental areas for this transition; (ii) sectoral agendas, especially for sectors that are more resource-intensive and export-oriented; and (iii) regional agendas, which should be adapted to the socio-economic specificities of each Portuguese region.
In these regional agendas, local participation will be endorsed, either by municipalities, intermunicipal communities or metropolitan areas. These entities should adapt the guidelines of CE within their scope and to the best of their abilities. On this level of action, CE converges with the valorisation of the territory, having taken into account the work of regional agendas in some regions, but also emerging topics in the national and European context.
Action plans for a circular economy recently created a need for characterisation of the regional economic metabolism to be included in the new regional agendas.
The concept of regional economic metabolism is supported by the analogy between the
consumption of resources and the production of waste by the socioeconomic system (economic metabolism), and the metabolism of living beings and ecosystems (ecological metabolism). This means that the metabolism is characterised by a set of inflows and outflows of materials, energy, and water, as well as consumption, use and storage. The quantification and subsequent analysis of these flows allows for the identification of synergies between the consumption needs of economic activities and the availability of materials to integrate productive cycles, identifying economically profitable
opportunities for regions (Action Plan and Regional Agenda for Alentejo’s Circular Economy).
Taking resource inputs, extractions, and imports into account, as well as analyzing outputs, such as exports and emissions in the environment (Figure 4), is a fundamental need in efficient resource conservation planning.
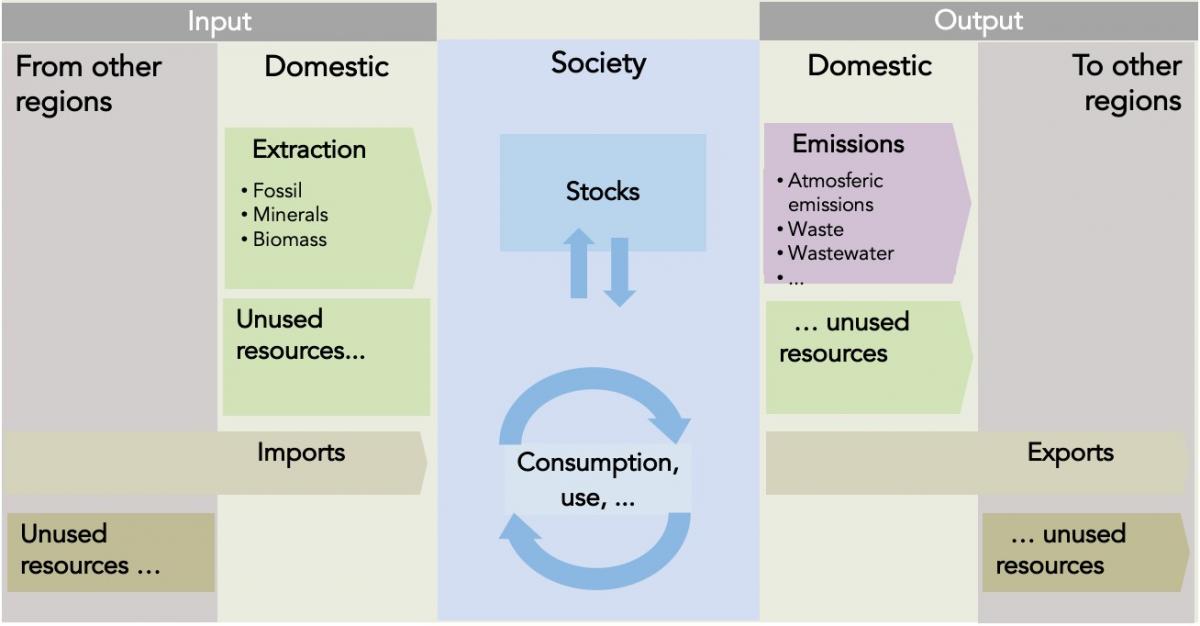
Figure 4: Components of a regional economic metabolism analysis.
However, there are few models available to calculate and represent the material flows for a region, they either don’t allow the inclusion of subregions, or they are not prepared to account for a large number of material categories.
In this context, some material flows modelling initiatives were developed in Portugal to assess the urban metabolism of a region, with the main objective of supplying information that allows to: (i) promote the CE of the region; (ii) promote a “smart” region (i.e., resource efficient); and (iii) promote investment.
Case study: Monitoring and mapping flows in the Centro Region in Portugal to boost industrial symbiosis
According to the APCE, each region should prepare a Circular Economy Regional Agenda, including an economic metabolism analysis.
Given the importance of the construction/building sector in the country, as it is responsible for 1/3 of the waste being produced in Portugal, metabolism analysis for construction materials has become imperative.
The importance of indicators
The framework for a material and energy flow analysis uses indicators and identifies opportunities to optimise the management of natural resources and energy. So, the modelling of regional economic metabolism indicators is a key task to identify inefficient use of natural resources and energy.
These indicators are important tools in monitoring and developing measures to improve resource management, the development of a circular economy, and to promote territorial and industrial symbiosis. In addition, they provide an integrated view of the movement of materials through the economy (and the territory), which is important for regional socio-economic development. Indicators are monitored at three stages: input (from other regions and domestic), use phase and output. The flow indicators are in accordance with Eurostat.
Is it easy to start?
A case study of southern region of Portugal, showcased the huge effort required, in terms of data collection. A wide range of stakeholders was consulted aiming to collect data on circular economy.
Is it worth it?
Through the analysis, it is easier to understand what is the metabolism; identify what are the most important materials in the value chain in terms of circular economy. Through this information, there is an opportunity for industrial symbiosis.
The REMET-UA model
A symbiosis model was developed in the central region of Portugal. Symbiosis mapping can lead to scenarios of cooperation between producers of waste and consumers and can feed design strategies. After mapping it is essential to identify relationship between all parties (including producers and consumers) in order to enable communication channels between them and go towards symbiosis.
In this context, the REMET-UA (Regional METabolism) model, version 1.0, was developed by a joint venture between the University of Aveiro and the companies Simbiente – Environmental Engineering and Management and Quaternaire Portugal.
The model makes it possible to identify feasible and logistic opportunities for the efficient use of resource between regional agents, based on the knowledge of quantities of material and sub-products in each location.
The REMET-UA model provides an economic analysis of material flows based on the methodology defined by Eurostat and has been developed according to three prerequisites:
- scale, the model can be adapted to any spatial scale (region, city, municipality, etc.)
- supported by the Microsoft Excel format, in order to guarantee the application of the model through an intuitive, user friendly, and linear interface for the user (interoperable model)
- interregional interactions, which means that the model quantifies the interactions between NUTS (Nomenclature of Territorial Units for Statistics) III sub-regions, representing them according to the user’s needs.
The REMET-UA model was developed to assess the regional economic metabolism of the Alentejo Region. It allows to identify business opportunities and circularity potential within a region and between different regions.
Characteristics of the REMET-UA model
- Focused (specific material flow analysis to seek opportunities of circularity)
- Scalable (capable of adapting to any territorial scale and flexible to alterations according to user needs)
- Participative (implementable with help from regional agents)
- Evolutionary (to allow its evolution since the first phase of development)
- Interpolated (developed in Microsoft Excel, allowing ease of use and integration with other tools)
- Regionalised (ready to have into account interactions between NUTS III sub-regions)
In addition, the model was developed in a participatory way, allowing, on one hand, the
involvement of regional actors in the collection of information, and on the other, the dissemination of concepts and the promotion of a collaborative spirit for future developments.
This model was designed by the following steps:
- Identification of interregional flows.
- Monitoring of indicators (quantitative and qualitative).
- Collection of data indicators (total values and per capita), allowing the user to assess the results for all materials or for a selected material, in each subregion.
- Identification of top three materials extracted and produced in each subregion.
- Creating links between actors to foster industrial symbiosis.
Benefits
- It possible to graphically represent the inputs and outputs of the economy of a region, and to gauge basic indicators set from the Eurostat methodology, calculating the materials that are stored or wasted, and which can lead to new opportunities
- It is flexible and allows adaptation to any territorial scale, and for the user to add new categories according to need and the availability of data
- Enables to identify the relevant sectors in terms of consumption and the strategic sectors for the development of the region
- Enables to define the average reference values and the origins of goods and products, internal flows in the various production and processing chains, and internal consumption and outputs of goods and products of the region
Constraints
The main constraints were the scattered available information, its lack of detail, with variable degrees of confidence, few data available at the NUTS III level (or with more detail), and a high time required for the collection of information (not systematized) in different entities.
Metabolism in Portugal: Current state
Raw materials use for the construction sector
At the moment, no periodically assessed indicators exist to measure how fully circular an economy is.
However, it is possible to trace the metabolism of an economy – how it has evolved in terms of extraction, productivity of use, and recycling and emissions/effluent performance.
Portugal’s economy shows a slow metabolism, as it tends to accumulate materials. It extracts and imports more raw materials than the amount of finished goods it exports, accumulating stock in materials, above all in real estate (e.g. buildings and infrastructure).
And in terms of value?
Material productivity has evolved more slowly than Spain or Ireland – countries which in 2005 had the same level of productivity. In 10 years, Portugal improved by 23% (the European Union (EU) by 30%).
During the financial crisis, domestic materials consumption fell and GDP stagnated. Material and energy efficiency were promoted, a positive measure which continued to be encouraged, but without any disruption in material productivity. From 2014, consumption of non-metallic minerals and biomass grew as the construction sector started to pick up. In 2015, non-metallic minerals (e.g. sand) accounted for 73% of the 145 million tonnes of materials extracted in Portugal.
In terms of efficiency of resources?
In terms of water use efficiency, only 65% of what is captured is effectively used and reuse is still residual when compared with other Member States (however, specific legislation was recently approved to encourage water reuse for non-drinking purposes, raising the ambition to improve this situation in the coming years; interesting examples are already implemented for golf courses irrigation, for example) . In energy, and despite the focus on renewable sources with a lessening of dependency on external energy, production and transportation is still essentially dependent on imported fossil fuels.
Since 2005, GHG emissions have fallen due to better prevention and control technologies, less polluting fuels and energy production, and improvements in the energy efficiency of processes. The trend in 2015, however, is for rising emissions as a result of economic growth and the use of coal to produce electricity.
Sectoral waste production also fell in the last 5 years (35%), in line with falling production and consumption; but the construction sector predominates. This situation is also likely to improve in the medium term, since the Portuguese government established the politic and economic compromise of reaching a carbon neutral economy until 2050.
The construction sector in Portugal is responsible for the greatest share of production in all sectors as a whole (40%) and in addition registered an increase in waste production per GDP unit generated. So it is no surprise that in a preliminary study conducted by the working group using the Ellen MacArthur Foundation methodology, construction is one of the priorities, along with transport (e.g. logistics), agriculture, forestry and the food industry. The Rebuild 17 project (funded by the EEA Grants mechanism) is other example of the construction sector potential for Circular Economy in Portugal (in this case, applied in Azores, an European outermost region). There is room for progress. For example, manufacturing spends 53% of turnover on raw materials, so reducing this amount, even if only by a small percentage, has a major impact.
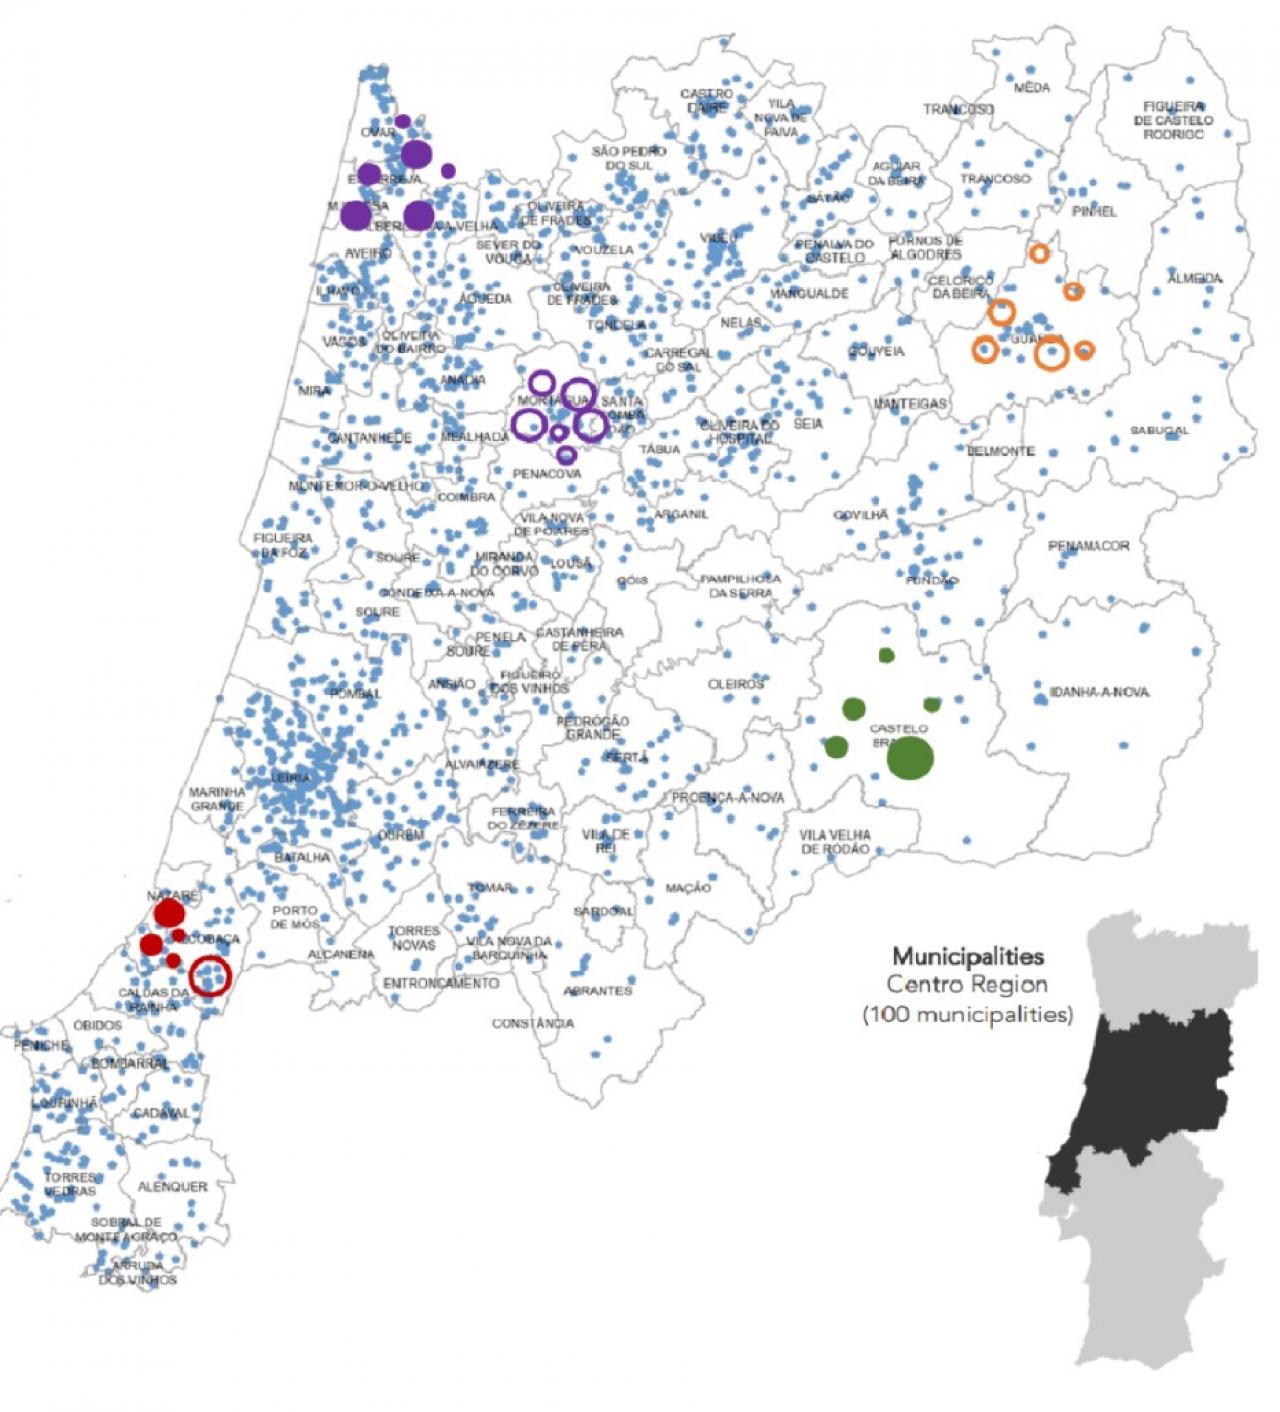
Application and results: Symbiosis mapping in the Centro region in Portugal
Taking into account the database of industrial establishments (NACE code, businesses size measured in number of employees, location identified through postal address); the Coordination and Development Regional Commission of Centro promoted a project that aims to pin a resources’ selection and characterization and its production and consumption locations, in order to find territorial symbiosis’ potential and design new value chains.
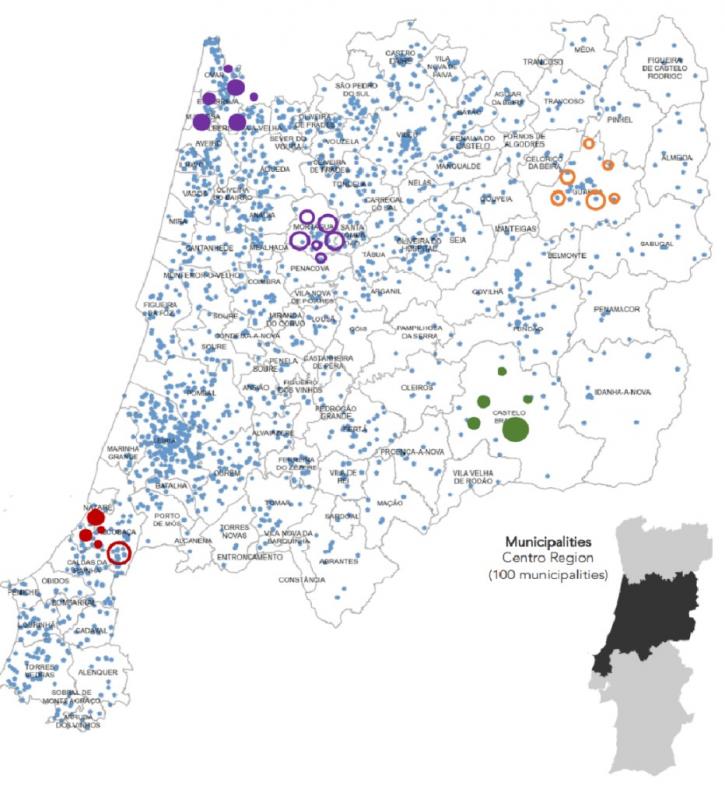
Figure 5: Industrial symbiosis map in the Centro Region in Portugal
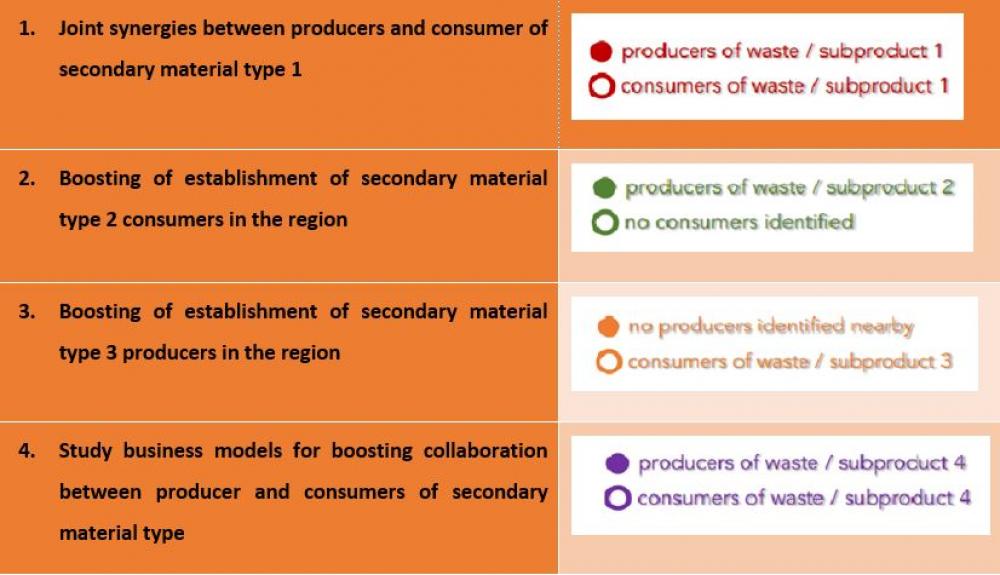
Throughout the process, undertook by a joint venture between Simbiente – Environmental Engineering and Management, the Chalmers University and the Polytechnic Institute of Viana do Castelo, algorithms are used to translate postal codes into geographic coordinates and NACE/ size into type and quantity of waste and other resources. By using this model, different strategies can be designed and served through the mapping and implementation of this symbiosis model in the region, depicted in Table 1:
Table 1: Strategies raised from the application of the model
Acknowledgements
This article has been produced in the frame of the URGE APN, financed by the URBACT Programme.
All partners have contributed with input in the frame of the transnational exchange meeting, hosted digitally by the Intermunicipal Community of West (OESTECim) in Portugal.
Special thanks to the team from the OESTECim: Paulo Simões, General Secretary, Sofia Mendonça, Local Coordinator, Ana Pires, Coordination and Development Regional Commission of Centro and especially Sérgio Bruno Costa, Founder and CEO at Simbiente - Environmental Engineering and Management.
Resources
- Carlos Borrego, Bruno Augusto, Sandra Rafael, Sílvia Coelho. CLIMATE CHANGE: CAUSES & CONSEQUENCES. Lisbon Civil Engineering Summit, 2019
- Action Plan for Circular Economy in Portugal: 2017-2020. Leading the Transition. Republica Portuguese.
- Afonso Silva, Bruno Augusto. Sandra Rafael . Johnny Reis , Myriam Lopes, Sérgio Costa and Carlos Borrego. Modelling of Regional Economic Metabolism. Climate, 2020
- Wolman, A. The Metabolism of Cities. Sci. Am. 1965, 213, 179–190.
- Maclaren, V. Developing Indicators of Urban Sustainability: A Focus on the Canadian Experience, 1st ed.; ICURR Press: Toronto, Canada, 1996.
- Kalmykova, Y.; Rosado, L. Urban Metabolism as Framework for Circular Economy Design for Cities. In Proceedings of the World Resources Forum 2015, Davos, Switzerland, 11–14 October 2015.
- Rosado, L.; Niza, S.; Ferrão, P. A Material Flow Accounting Case Study of the Lisbon Metropolitan Area using the Urban Metabolism Analyst Model. J. Ind. Ecol. 2014, 18, 84–101.
- FCT. Agenda Temática de Investigação e Inovação: Economia Circular, 1st ed.; FCT: Lisbon, Portugal, 2019.
- Action Plan and Regional Agenda for Alentejo’s Circular Economy—Study for the Regional Economic Metabolism Analysis.
- European Commission. Economy-Wide Material Flow Accounts and Derived Indicators: A Methodological Guide, 1st ed.; O_ce for O_cial Publications of the European Communities: Luxembourg; Brussels, Belgium, 2001.
- Silva, A.; Augusto, B.; Rafael, S.; Reis, J.; Lopes, M.; Costa, S.; Borrego, C. Analysis of regional economic metabolism through modelling. Energy Rep. 2020, 6, 102–107