Insights from the URGE network on the field of circular economy indicators: A framework for better-informed decision making.
By Dr. Eleni Feleki, Lead Expert of the URGE Action Planning Network
Introduction
The Commission’s Circular Economy package (2018) includes a monitoring framework to measure progress towards a circular economy at both EU and national level. This monitoring framework consists of a set of 10 key indicators, which cover each phase of a raw material’s life cycle and the related economic aspects.
Which indicators are proposed by the EC to assess progress?
The EC monitoring framework for circular economy is composed of ten indicators, some of which are disaggregated into sub-indicators, capturing four key areas of the Circular Economy Action Plan.
Table 1: Indicators included in the EC Circular Economy monitoring framework
Key areas | Indicators |
Production & consumption | 1. EU self-sufficiency for raw materials 2. Green public procurement 3. Waste generation a. Generation of municipal waste per capita b. Generation of waste excluding major mineral waste per GDP unit c. Generation of waste excluding major mineral waste per domestic material consumption unit 4. Food waste |
Waste management | 5. Recycling rates a. Recycling rate of municipal waste b. Recycling rate of all waste excluding major mineral waste 6. Recycling/recovery for specific waste streams a. Recycling rate of overall packaging waste b. Recycling rate of plastic packaging waste c. Recycling rate of wooden packaging d. Recycling rate of electrical and electronic waste (e-waste) e. Recycling of biowaste per capita f. Recovery rate of construction and demolition waste |
Secondary raw materials | 7. Contribution of recycled materials to raw materials demand a. End-of-life recycling input rates b. Circular material use rate 8. Trade in recyclable raw materials |
Competitiveness/ innovation | 9. Private investments, jobs and GVA related to circular economy sectors a. Gross investment in tangible goods b. Number of persons employed c. Value-added at factor cost 10. Number of patents related to recycling and secondary raw materials |
The indicators are calculated based on existing information from Eurostat, the Raw Materials scoreboard and the Resource Efficiency scoreboard. Eight indicators are already present in other European frameworks as well. The other indicators are under development: ‘Food Waste’ (also foreseen in the revision of the EU Waste Directive) and ‘Green Public Procurement’ (GPP that may depend on the inclusion of relevant requirements like reparability, durability and recyclability that will be present in public contracts and procurements).
The CE monitoring framework also uses material flow analysis (MFA) with Sankey diagrams to give an overview of material flows in the EU. The diagrams show aggregated information of metallic and nonmetallic materials, fossil energy, and biomass providing an initial guide for a more detailed MFA.
Although several countries have developed circular economy strategies at a national level, few of them have set up a monitoring framework (OECD synthetic report, 2020). Generally speaking, many of these indicators focus on waste management. For example, in France, the “10 Key Indicators for Monitoring the Circular Economy” launched in 2017, includes a set of 10 indicators for waste management, consumer demand, behaviour and supply from economic stakeholders.
SDGs and the EC framework for monitoring circular economy
At the heart of the ‘’2030 Agenda for Sustainable Development’’ lay the 17 Sustainable Development Goals, (SDGs) which are an urgent call for action by all countries in a global partnership. In this context circular economy is recognized for its importance towards eliminating waste and the continual use of resources as it aims to keep products, equipment and infrastructure in use for longer, thus improving the productivity of these resources.
CE and SDGs are both relevant pillars for our sustainable development. The question that raises is: To what extent are circular economy practices relevant for the implementation of the SDGs?
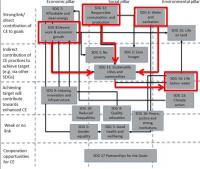
Figure 1: Interaction between SDGs and CE practices. Source: Schroeder et al., (2018)
Based on the scientific work of Schroeder et al. (2018), indicators included in the SDG framework have been classified according to their ability to address circular economy. The classification has been made using the following categories: (1) direct/strong contribution of circular economy practices to achieve each SDG (2) indirect contribution (3) progress on SDG drives the uptake of circular economy practices (4) weak or no link and (5) synergistic opportunity to promote circular economy practices. Although circular economy is closely related to SDG 12 Sustainable Consumption and Production, CE practices and principles are transversal. The strongest relationships and synergies between CE practices and SDGs lie within SDG 6 Clean Water and Sanitation, SDG 7 Affordable and Clean Energy, SDG 8 Decent Work and Economic Growth, SDG 12 Sustainable Consumption and Production and SDG 15 Life on Land.
Taking into consideration the classification of SDGs according to their ability to address circular economy practices, the SDGs have also been grouped (Schroeder et al., 2018) according to economic, social, and environmental pillar they reflect, results are depicted in Figure 1, where the red arrows between the SDGs indicate the main interactions and connections between the SDGs in relation to circular economy practices.
SDGs and the construction sector
Innovative business and refurbishment practices in construction sectors interact strongly with Goal 11 Sustainable Cities and Communities, especially enhancing the results of the target 11.6: Reduce the adverse per capita environmental impact of cities by 2030. To scale up refurbishment and repair practices globally, international standards can play an important role. In this sense, a new European approach to assess and report on the sustainability performance of buildings, throughout the full life cycle with a circular approach has been introduced: Levels(s), bringing minimum numbers of indicators, with maximum leverage to deliver sustainability taking into consideration the need to foster CE.
SDGs and Level (s)
Level(s) is an assessment and reporting framework that provides a common language for sustainability performance of buildings. Level(s) promotes lifecycle thinking for buildings and provides a robust approach to measuring and supporting improvement from design to end of life, for both residential buildings and offices.
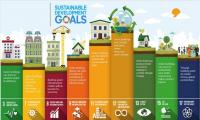
Figure 2: SDGs and the built environment.
Level(s) is divided into three areas, each with its own subject matter and desired outcomes
- Resource use and environmental performance during a building’s lifecycle
- Health and comfort
- Cost, value, and risk
Level(s) provides a set of indicators and common metrics for measuring the performance of buildings along their life cycle. As well as environmental performance, which is the main focus, it also enables other important related performance aspects to be assessed using indicators and tools in the áreas presented above.
It is structured as follows:
- Macro-objectives: An overarching set of six macro-objectives for the Level(s) framework that contribute to EU and Member State policy objectives in areas such as energy, material use and waste, water and indoor air quality.
- Core Indicators: A set of 16 common indicators, together with a simplified Life Cycle Assessment (LCA) methodology, that can be used to measure the performance of buildings and their contribution to each macro-objective.
Table 2: Set of indicators and macro-objectives in Level(s)
Thematic areas | Macro objectives | Indicators | |||
Resource use & environmental performance | GHG emisssions along a buildings life cycle | Use stage energy performance (kWh/m2/yr) | Life cycle Global Warming Potential (CO2 eq./m2/yr) |
|
|
Resource efficient and circular material life cycles | Bill of quantities, materials and lifespans | Construction and Demolition waste | Design for adaptability and renovation | Design for deconstruction | |
Efficient use of water resources | Use stage water consumption (m3/occupant/yr) |
|
|
| |
Health and comfort | Healthy and comfortable spaces | Indoor air quality | Time out of thermal comfort range | Lighting | Acoustics |
Cost, value and risk | Adaption and resilience to climate change | Life cycle tools: scenarios for projected future climatic conditions | Increased risk of extreme weather | Increased risk of flooding |
|
Optimised life cycle cost and value | Life cycle costs (€/m²/yr) | Value creation and risk factors | |||
Use of Level(s): Case studies
Slovenia offices
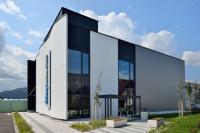
Figure 3: EXPERIENCE CENTRE - Knauf Insulation. Source: Taking action on the TOTAL impact of the construction sector. Luxembourg Publications Office of the European Union 2019.
Finland residential

Figure 4: LIGHTHOUSE JOENSUU - Stora Enso. Source: Taking action on the TOTAL impact of the construction sector. Luxembourg Publications Office of the European Union 2019.
Spain office

Figure 5: Headquarters of the Ministry of Territory and Sustainability of the Catalan Government and the Housing Agency of Catalonia. Source: Taking action on the TOTAL impact of the construction sector.
The EU partnership for CE indicators framework (local level)
The EU Urban Agenda has also identified indicators that can be useful for cities to assess their transition to the circular economy. (CE strategy at urban level: OEDC indicators to set and implement CE strategy at local level). It introduces 140 indicators for circular economy transition in cities including two overarching indicators on GHG and the availability of a circular economy strategy at the local level.
The OECD synthetic report
The recent OECD synthetic report includes an inventory that provides an overview of circular economy measurement frameworks. The OECD Inventory of Circular Economy Indicators (forthcoming) collected 474 Circular Economy - related indicators, between 2018 and 2020. There are categorised into five main categories (economy and business; environment; governance; infrastructure and technology; and jobs), 33 sub-categories and 11 sectors. In the selection of indicators per sector, there are several examples that might fit into URGE. (i.e. indicators about built environment, resources and materials etc). Indicators that fall under the built environment sector:
- Construction works with circular design
- Financial resources mobilised for experiments on the building sector
- Voluntary agreements signed to reuse of building components
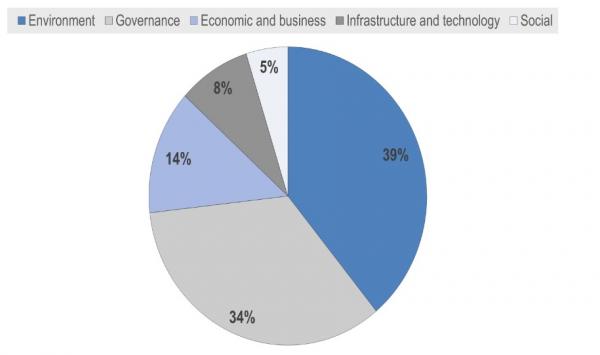
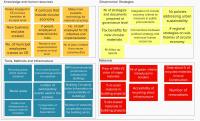
Figure 6: OECD examples, indicators by sector. Source: OECD, 2020
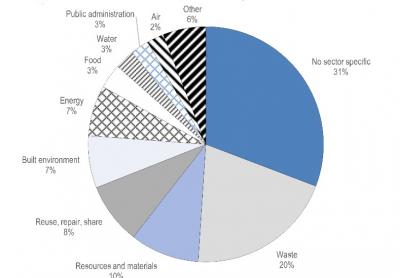
Figure 7: OECD indicators per category and sub-category. Source: OECD, 2020
Selected indicators for setting and implementing a circular economy strategy
When developing a circular economy strategy, it is important to take into account the co-ordination across municipal and regional departments, the involvement of stakeholders for an inclusive and participative process, select several projects for the achievement of established targets and identify sources of funding. When the strategy has been set and implemented, key results concern the creation of businesses and jobs, the number of products procured according to circular criteria, as well as environmental conditions such as waste diverted from landfill.
The tables below depict the key indicators contained in the OECD Survey on the Circular Economy in Cities and Regions (2020) for (i) setting and (ii) implementing circular economy strategy indicators.
Table 3: Setting the CE strategy indicators. Source: OECD Survey on the Circular Economy in Cities and Regions (2020) for setting and implementing CE strategy indicators.
Type of indicator | Indicators for the circular economy strategy: inputs, process and output |
Process | No. of public administrations/departments involved |
Process | No. of stakeholders involved |
Input/process | No. of actions identified to achieve the objectives |
Input/process | No. of projects to implement the actions |
Process | No. of projects financed by the city/regional government/Total number of projects |
Process | No. of projects financed by the private sectors/Total number of projects |
Process | No. of staff employed for the circular economy initiative and implementation within the city |
Table 4: Implementing the CE strategy. Source: OECD Survey on the Circular Economy in Cities and Regions (2020) for setting and implementing CE strategy indicators.
Type of incicator | Indicator for the circular economy strategy: inputs, process and output |
Environmental output | Waste diverted from landfill (T/inhabitant/year or %) |
Environmental output | CO2 emission saved (T CO2/capita or %) |
Environmental output | Raw material avoided (T/inhabitant/year or %) |
Environmental output | Use of recovered material (T/inhabitant/year or %) |
Environmental output | Energy savings (Kgoe/inhabitant/year or %) |
Environmental output | Water savings (ML/inhabitant/year or %) |
Socio-economic output | No. of new circular business (e.g. companies, start-up, etc.) created to implement the circular economy initiative |
Socio-economic output | No. of businesses (e.g. companies, start-ups, etc.) adopting circular economy principles |
Socio-economic output | Economic benefits (e.g. through additional revenue and costs saving) (EUR/year) |
Socio-economic output | No. of employees of new circular business |
Socio-economic output | No. of jobs created from circular activities |
Governance output | No. of companies coached by the city/region to adopt circular economy principles |
Governance output | No. of contracts awarded by the purchasing department of the city/region that include a circular economy criterion/ Total number of contracts |
Governance output | City/region % of public investment dedicated to the circular economy initiative/total public investment by the city/region |
Circular economy monitoring frameworks introduced by European cities
Several circular economy indicators are monitored by European cities as a result of their strategy. Their main purpose is to assess how the city is performing towards the achievement of targets. Specific examples refer to the cities of Amsterdam, Paris, Turku and Porto.
An example is depicted, coming from the city of Amsterdam that monitors three main indicators: value retention, economic and ecological impacts. These three indicators, which have been developed by a programme of the Ministry of Infrastructure and the Environment of the Netherlands, are comparable with the national level.
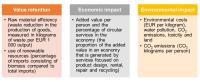
Figure 8: CE indicators in the city of Amsterdam. Source: Circle Economy et al. (2016), “Circular Amsterdam - A vision and action agenda for the city and metropolitan area”, https://www.circle-economy.com/resources/developing-a-roadmap-for-the-first-circular-city-amsterdam
Other cities that monitor circular economy indicators are Munich and Tilburg, mostly focused on waste (e.g. residual waste, waste separation, waste recovery through inclusive recycling programmes, recycling rates and monitoring of results from recycling programmes). More information about the frameworks used by European cities to monitor circular economy are available here: Indicators applied at local level (OECD).
Which indicators did the URGE partners propose?
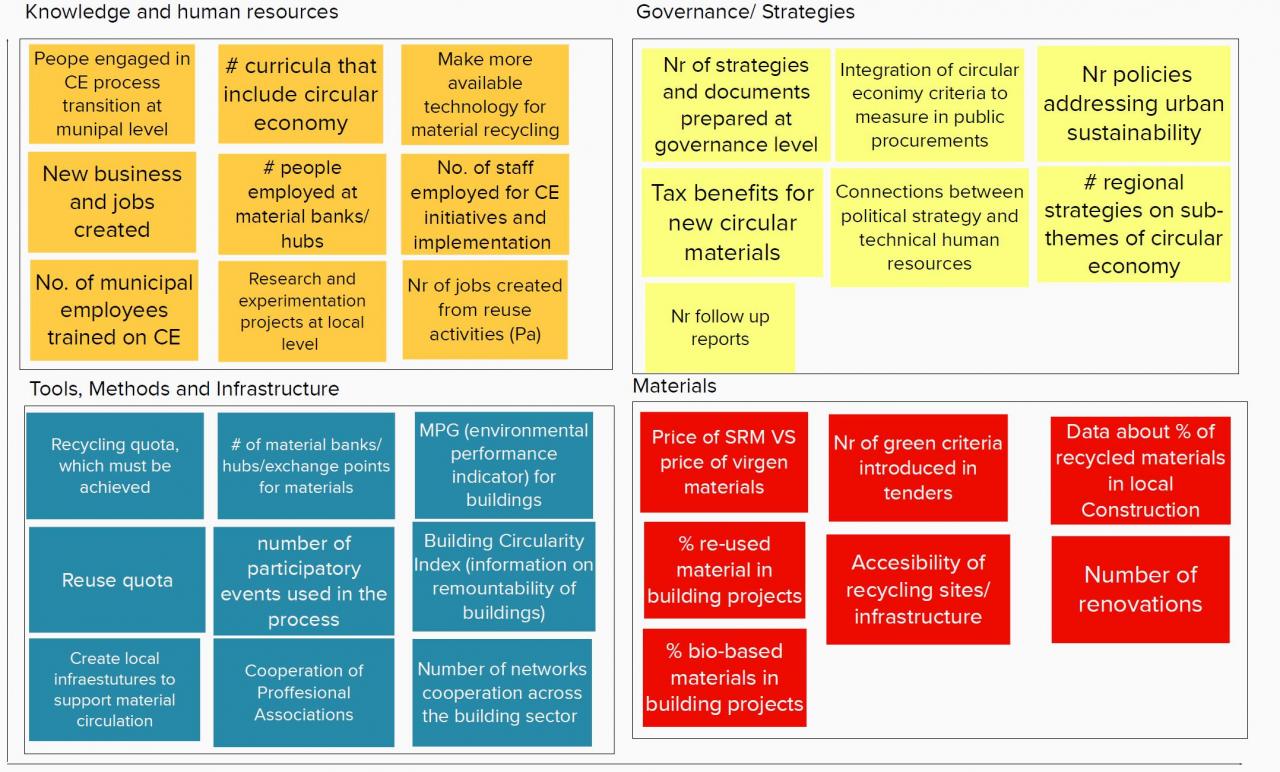
During the URGE transnational meeting digitally held by OESTECim, the URGE cities reflected on indicators that they would include in their monitoring frameworks, at local level, to measure circular economy. The results of the brainstorming activity are depicted below.
Infographic 1: Indicators proposed per line of intervention
Conclusions
Introducing a local framework of indicators is most often a great pain for decision makers. The ultimate goal of monitoring is usually not obvious, integrated approach is missing, data is usually missing or not reliable and last but not least, there is usually a freedom to include or exclude indicators from the local monitoring framework, according to the willing of the decision maker, introducing thus great objectivity to the results. The scope and also the calculation method for each indicator in a framework, must be well agreed and documented (Feleki et al, 2020; Feleki et al, 2018).
Indicators that can be included in a monitoring framework can be classified based on the needs they serve (indicatively) as follows:
- To assess the governance model integration and performance
- To assess the environmental impact from the substitution of raw materials’ use with secondary materials taking always into account at least GHG emissions from transportations
- To assess socio-economic impact from the implementation of a circular economy strategy, through for example the introduction of new business models, the assessment of training and awareness raising activities, the social impact and many more
- To monitor the materials that are produced/ imported/ consumed at a certain area either locally or regionally and to map the points of production and consumption to enable effective industrial symbiosis
Based on indicators’ results, better-informed decision making is achieved and actions are agreed, prioritised and implemented. Urban-level indicators support the implementation of policies and decisions in areas such as procurements, integrated resource management, raising of awareness, designing efficient materials’ flows, business models to raise growth and jobs. Additionally, in our case, in order to serve circular economy-approach in the built environment, indicators can also zoom on a specific category of a material for example concrete, wood, bulky waste or other.
Of course, the question of data existence is always present, but lack of data to monitor an indicator that is needed in order to meet the scope of the framework or to meet the strategic goals, should not be a reason for excluding this indicator at first place.
Acknowledgements
This article has been produced in the frame of the URGE APN, financed by the URBACT Programme.
All partners have contributed with input in the frame of the transnational exchange meeting, hosted digitally by the OESTECim.
Special thanks to the team from the City of Granada for their valuable contributions to this topic: Professor Montserrat Zamorano, Dean of the Civil Engineering Faculty University of Granada, Carmen Diaz, University of Granada, Agustin Castillo Martinez, City of Granada & URGE local coordinator.
Resources
- “Measuring progress towards a circular economy in the European Union – Key indicators for a monitoring framework”, EC. Available at: https://ec.europa.eu/environment/circular-economy/pdf/monitoring-framework_staff-working-document.pdf.
- Level(s). Taking action on the TOTAL impact of the construction sector. Luxembourg Publications Office of the European Union 2019. Doi 10.2779/458570. Level(s).
- OECD Survey on the Circular Economy in Cities and Regions (2020) for setting and implementing CE strategy indicator (2020)
- Schroeder et al., (2018). The Relevance of Circular Economy practices to the sustainable development goals. Journal of Industrial Ecology.
- Circle Economy et al. (2016), “Circular Amsterdam - A vision and action agenda for the city and metropolitan area”. Available at: https://www.circle-economy.com/resources/developing-a-roadmap-for-the-first-circular-city-amsterdam
- Feleki et al., (2020). Holistic methodological framework for the characterization of urban sustainability and strategic planning, Journal of Cleaner Production 243, 118432. (https://doi.org/10.1016/j.jclepro.2019.118432).
- Feleki et al., (2018). Characterisation of sustainability in urban areas: assessment of tools with emphasis in European urban areas, Journal of Sustainable Cities and Society. (https://doi.org/10.1016/j.scs.2018.08.025).